Tag: sports dome ROI

  • Sports Dome ROI Analysis: Break-Even, Payback, and Revenue Scenarios (2026)

    Sports Dome ROI Analysis: Break-Even, Payback, and Revenue Scenarios (2026)

    Sports dome ROI analysis — the profitable operators I have worked with all understood the same four financial levers before they broke ground.

    The most important question any prospective dome operator asks is whether the investment will actually pay back. The short answer: yes — for the right facility in the right market with the right programming.


    How to think about dome ROI

    Net annual profit = Total revenue − Operating costs Payback period = Capital cost ÷ Net annual profit


    Revenue benchmarks by sport

    Tennis (per court, per hour)

    MarketPeak rateOff-peak rate
    London / New York£60–£110 / $70–$130£30–£60 / $35–$75
    Regional UK cities£20–£40£12–£22
    US suburban markets$25–$60$15–$35

    Football / Soccer (per pitch, per hour)

    Pitch typePeak rate (UK)Peak rate (US)
    5-a-side£55–£120$60–$140
    11-a-side£120–£280$130–$300

    Pickleball (per court, per hour)

    MarketDrop-in rateCourt hire rate
    US suburban$8–$20 per player$25–$60 per court
    US urban$12–$30 per player$40–$90 per court

    Padel (per court, per hour)

    MarketPeak rateOff-peak rate
    UK£30–£65£18–£40
    Spain / France / Germany€20–€45€12–€28

    Revenue model: 4-court tennis dome (US suburban, year-round)

    • Capital cost: $520,000 | Operating costs: $70,000/year
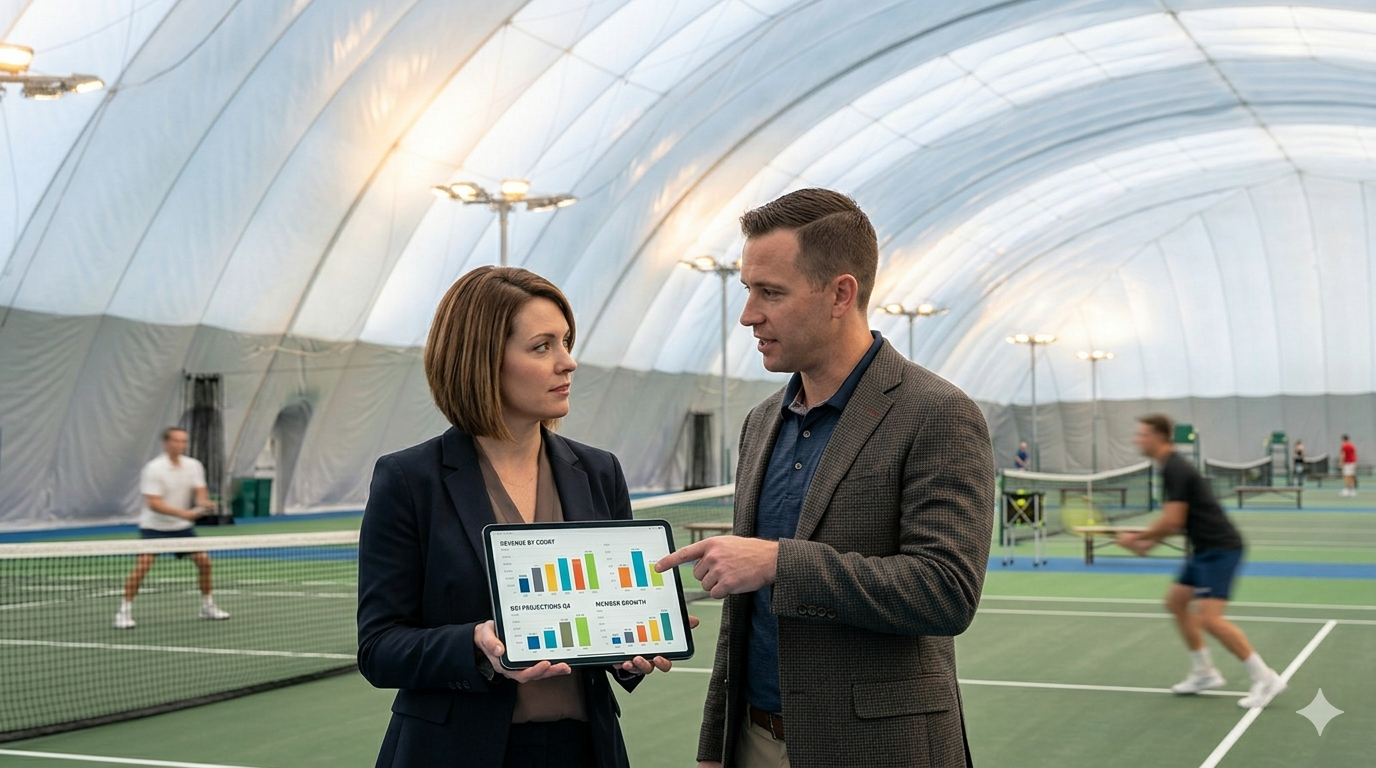
    • Weekly total revenue: ~$9,870
    • Annual gross: ~$513,000
    • Net annual profit: ~$445,000
    • Payback period: ~14 months (high-utilisation scenario)
    • Conservative scenario (55–60% utilisation): net profit $200,000–$280,000, payback 2–3 years

    Revenue model: soccer dome, 11-a-side (UK, year-round)

    • Capital cost: £1,600,000 | Annual operating costs: £160,000
    • Annual gross: £365,000 | Net profit: £205,000
    • Payback: ~7.8 years (adding tournaments and academies reduces to 5–6 years)

    Revenue model: 4-court pickleball dome (US suburban, seasonal)

    • Capital cost: $380,000 | Annual operating costs: $55,000
    • Total seasonal revenue: ~$280,000 | Net profit: $225,000
    • Payback: ~1.7 years

    Realistic ROI ranges by dome type

    Dome typeCapital costNet annual profit rangePayback range
    2-court seasonal tennis bubble$160,000–$250,000$60,000–$130,0001.5–3.5 yrs
    4-court year-round tennis dome$500,000–$800,000$150,000–$400,0002–5 yrs
    4-court pickleball dome (seasonal)$300,000–$500,000$130,000–$280,0001.5–3 yrs
    Multi-sport dome (5-a-side + courts)$700,000–$1,400,000$150,000–$400,0003–6 yrs
    11-a-side soccer dome (year-round)$1,200,000–$2,500,000$100,000–$300,0005–10 yrs

    What drives the biggest variance in payback period

    1. Utilisation rate — every 10% additional utilisation changes annual net profit by $40,000–$150,000.
    2. Programming vs pure rental — leagues, academies, and tournaments consistently outperform court-hire-only models.
    3. Peak/off-peak ratio — monetising daytime weekday slots dramatically improves unit economics.
    4. Capital cost per m² — cheapest dome is not necessarily best ROI.
    5. Energy cost — specification decisions (skin count, heat pump, LED) have large financial impact.

    Payback period most operators achieve

    • Top quartile (high demand, strong programming, high utilisation): 1.5–3 years
    • Median (good market, moderate programming, 60–70% utilisation): 3–5 years
    • Bottom quartile (weaker market, rental-only): 6–10+ years

    HeroX AirDomes provides detailed ROI modelling as part of the feasibility process for all new projects.