Category: ROI & Business Case

Financial modelling, payback periods, NPV, and investor briefs.

  • Rendement berekenen voor een sportfaciliteit met luchtdom: complete gids (2026)

    Rendement berekenen voor een sportfaciliteit met luchtdom: complete gids (2026)

    Luchtdom rendement sportfaciliteit — na het realiseren van luchtdommen in Nederland en België ken ik de exploitatiecijfers van binnenuit.

    Een luchtdom is een van de meest kostenefficiënte manieren om binnenruimte voor sport te realiseren. Maar de juiste investeringsbeslissing vereist een helder beeld van zowel de opbrengsten als de kosten.


    Investering: wat kost een luchtdom in Nederland?

    Type accommodatieOppervlakSeizoensdomPermanent dom
    Tennisbubbel 2 banen~1.000 m²€100.000–€165.000€160.000–€275.000
    Tennisdom 4 banen~2.000 m²€185.000–€340.000€300.000–€550.000
    Padelhal 4 banen~1.700 m²€155.000–€280.000€250.000–€460.000
    Multisportdom~3.500 m²€310.000–€580.000€500.000–€950.000
    Voetbaldom (grote veld)~9.500 m²€850.000–€1.600.000€1.300.000–€2.600.000

    Rendement berekenen: de formule

    Netto jaarresultaat = Totale omzet − Exploitatiekosten Terugverdientijd = Investering ÷ Netto jaarresultaat


    Omzetbenchmarks per sport (Nederland)

    SportPiektarief (€/uur)Daluren (€/uur)
    Tennis€22–€50€12–€28
    Padel€25–€55€15–€32
    Voetbal (5-a-side)€60–€130€35–€70

    Rekenvoorbeeld: 4-baanstennisdom (permanent, Nederland)

    • Investeringskosten: €520.000 | Exploitatiekosten: €75.000/jaar
    • Totale jaaromzet: ~€395.000 | Netto jaarresultaat: ~€320.000
    • Terugverdientijd: ~1,6 jaar (optimistisch scenario)
    • Realistisch (55–65% bezetting): terugverdientijd 2,5–4 jaar

    Rekenvoorbeeld: 4-baanspadelhal (seizoensgebonden, 6 maanden)

    • Investeringskosten: €280.000 | Seizoensexploitatiekosten: €45.000
    • Netto seizoensresultaat: €115.000
    • Terugverdientijd: ~2,4 jaar

    Bezettingsgraad: de meest kritische variabele

    BezettingsgraadNetto jaarresultaat (4 tennisbanen)Terugverdientijd
    45%€80.000–€120.0004–6 jaar
    60%€130.000–€200.0002,5–4 jaar
    75%€200.000–€320.0001,5–2,5 jaar

    Subsidiemogelijkheden in Nederland

    NOC*NSF / Nationale Sportraad, gemeentelijke sportsubsidies, ISDE (investeringssubsidie duurzame energie), SDE++-regeling.


    Vergunningen

    • Seizoensgebonden: vergunningplicht afhankelijk van gemeente en duur.
    • Permanent: omgevingsvergunning vereist, constructieve berekening conform Eurocode, brandveiligheidstoets.

    HeroX AirDomes ontwerpt, fabriceert en installeert luchtgedragen membraanconstructies voor sport in Nederland, Europa, het Verenigd Koninkrijk, de VS en de VAE.
  • Sportdom als Geschäftsmodell: Hallenvermietung planen und rentabel betreiben

    Sportdom als Geschäftsmodell: Hallenvermietung planen und rentabel betreiben

    Sportdom Geschäftsmodell — nach der Realisierung von Anlagen in der DACH-Region kenne ich die Modelle, die wirklich funktionieren.

    Ein Luftdom ist mehr als eine überdachte Sportstätte. Richtig betrieben, ist er ein Geschäftsmodell mit vergleichsweise geringem Kapitaleinsatz, kurzen Amortisationszeiten und hoher Flexibilität.


    Das Grundprinzip: Fläche in Buchungsstunden verwandeln

    Jahresumsatz = Buchbare Stunden × Auslastung × Stundensatz


    Welche Sportarten eignen sich für Hallenvermietung?

    SportartStoßzeitenStundensatz (Spitze, DE)
    TennisAbend, Wochenende25–70 €/Court
    Fußball (5-a-side)Abend60–140 €/Platz
    PadelAbend, Wochenende25–60 €/Court
    Volleyball / BasketballAbend50–120 €/Feld
    Leichtathletik-TrainingMorgen, Nachmittag80–200 €/Stunde

    Investitionskosten (schlüsselfertig, ohne Bodenbelag)

    AnlageFlächeSaisonalPermanent
    Tennisblase 2 Courts~1 000 m²100.000–165.000 €160.000–280.000 €
    Tennisdom 4 Courts~2 000 m²185.000–340.000 €300.000–550.000 €
    Mehrzweckdom (Fußball + Courts)~3 500 m²310.000–580.000 €500.000–950.000 €
    Fußballdom 11 gegen 11~9 500 m²850.000–1.600.000 €1.300.000–2.600.000 €

    Betriebskosten pro Jahr (2.000 m², Deutschland)

    KostenpositionJahreskosten
    Energie (Ventilatoren + Heizung + Beleuchtung)22.000–55.000 €
    Wartung und Inspektionen6.000–15.000 €
    Versicherung4.000–12.000 €
    Gesamt (ohne Personal)32.000–82.000 €/Jahr

    Geschäftsmodelle Hallenvermietung

    • Modell 1: Reine Flächenvermietung — Online-Buchungssystem, geringe Personalkosten.
    • Modell 2: Trainings- und Akademieangebote — planbare Wiederholungsumsätze.
    • Modell 3: Ligabetrieb und Turniere — 3- bis 5-fache Einnahmen vs. Standard-Platzvermietung.
    • Modell 4: Mitgliedschaften — wiederkehrender Monatsumsatz.

    Amortisation

    AnlageInvestitionJahresnettogewinnAmortisation
    Tennisblase 2 Courts (saisonal)130.000 €50.000–100.000 €1,5–3 Jahre
    Tennisdom 4 Courts (permanent)420.000 €100.000–250.000 €2–4 Jahre
    Padel 4 Courts (saisonal)260.000 €90.000–180.000 €1,5–3 Jahre
    Mehrzweckdom (permanent)700.000 €130.000–300.000 €3–5 Jahre

    Fördermöglichkeiten

    DOSB / Landessportbünde, KfW-Programme, Bundesförderprogramm Nationale Projekte des Städtebaus, EU-Strukturfonds (EFRE). Ein gut ausgearbeiteter Förderantrag kann 15–35% der Investitionssumme abdecken.


    HeroX AirDomes plant und installiert Luftdome für Sport und Gewerbe in Deutschland, Europa, dem Vereinigten Königreich, den USA und den VAE.

  • How to Maximise Revenue at an Indoor Sports Dome: The Operator’s Playbook

    How to Maximise Revenue at an Indoor Sports Dome: The Operator’s Playbook

    Maximise indoor dome revenue — I have seen operators double their income by changing three things they had never considered optimising.

    The facilities that generate the best returns are rarely the ones with the biggest domes or the lowest construction costs. They are the ones with the most disciplined approach to programming, pricing, and revenue diversification.


    The fundamental economics

    An indoor sports dome has a fixed cost base regardless of usage. Every unsold peak hour is revenue that cannot be recovered.


    Revenue stream 1: Court and pitch hire

    Rate benchmarks:

    SportPeak rate (US)Off-peak rate (US)Peak rate (UK)Off-peak (UK)
    Tennis (per court/hr)$35–$120$20–$60£18–£100£10–£50
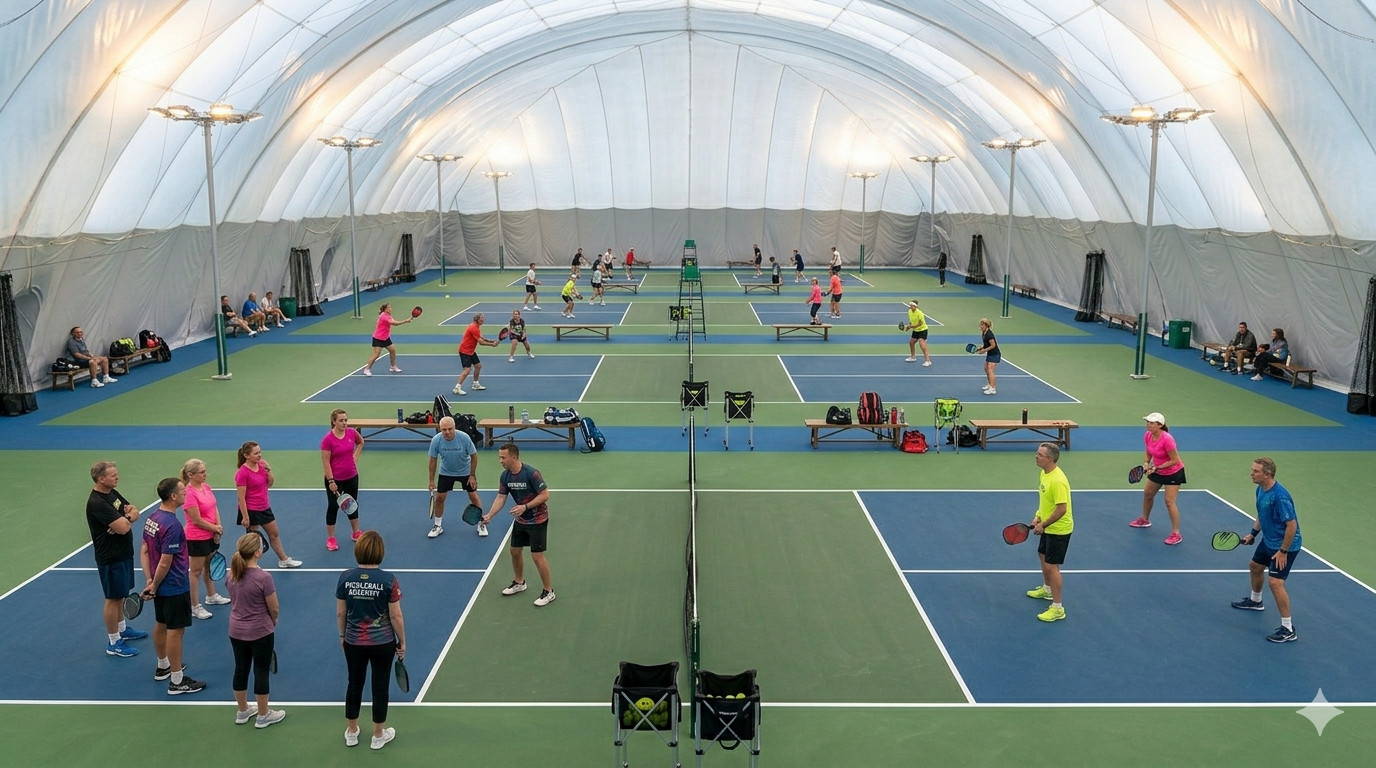
    Pickleball (per court/hr)$25–$90$15–$50£20–£50£12–£30
    Football 5-a-side (per pitch/hr)——£55–£120£30–£70
    Padel (per court/hr)$30–$80$18–$45£30–£65£18–£40

    Key tactics: dynamic pricing (yield management), block bookings (offer 10–15% discounts for 10-week commitments), and booking software (CourtReserve, PlaySight, Club Automation).


    Revenue stream 2: Leagues and competitions

    Leagues are the highest ROI revenue stream for most operators.

    Tournament revenue (4-court tennis open, 64 players):

    Income itemAmount
    Entry fees$4,800
    Food and drink$500–$1,500
    Sponsor logos$500–$2,000
    Total$6,000–$9,100

    vs standard weekend hire: $1,440. Tournament revenue is 4–6× standard hire for the same hours.


    Revenue stream 3: Coaching and academy programmes

    Staff coaching model: charge market rates ($60–$150/hr tennis US; £40–£100/hr UK). Margin per session: 40–65%.

    Franchise / licence model: external coaches pay slightly below rack rate (80–90%). Zero management overhead.

    A 20-week junior tennis academy on 2 courts: – 24 students × $350 = $8,400 total – Net contribution after court costs: $5,400


    Revenue stream 4: Memberships

    Membership typeMonthly feeValue proposition
    Open access (off-peak only)$80–$150Unlimited weekday daytime play
    Priority booking$140–$2507-day advance peak access
    Family membership$200–$3502 adults + children
    Corporate membership$500–$1,5004 named users, invoiced monthly

    Revenue stream 5: Schools and education partnerships

    Block contract with 3 local schools (2 × 2-hour sessions/week): – £28,800 guaranteed income over a 32-week academic year – Uses off-peak slots that would otherwise be empty


    Revenue stream 6: Corporate and events

    A 2-hour corporate pickleball/tennis event for 12 people: – Court hire + equipment + food/drink = $680 total – vs $330 standard hire (50–100% premium for exclusive use)


    Revenue stream 7: Fitness and non-sport programming

    Bootcamp (6am–8am), yoga (mid-morning), HIIT, children’s multi-activity — block-hire to external fitness operators is the simplest model.


    Revenue stream 8: Sponsorship and naming rights

    Perimeter LED panels: £2,000–£10,000/year. Court naming: £5,000–£25,000/year. A mid-size dome can generate £15,000–£50,000/year in sponsorship at maturity.


    Programming sequence: how to build a full facility

    • Months 1–3: Court hire only. Fill peak slots.
    • Months 3–6: Launch leagues. Convert hirers to weekly returners.
    • Months 6–12: Introduce membership.
    • Year 2: Schools, corporate, academies.
    • Year 3+: Dynamic pricing, sponsorship, secondary revenue.

    HeroX AirDomes works with clients throughout the feasibility, design, and post-installation phases to model revenue potential.

  • Sports Dome ROI Analysis: Break-Even, Payback, and Revenue Scenarios (2026)

    Sports Dome ROI Analysis: Break-Even, Payback, and Revenue Scenarios (2026)

    Sports dome ROI analysis — the profitable operators I have worked with all understood the same four financial levers before they broke ground.

    The most important question any prospective dome operator asks is whether the investment will actually pay back. The short answer: yes — for the right facility in the right market with the right programming.


    How to think about dome ROI

    Net annual profit = Total revenue − Operating costs Payback period = Capital cost ÷ Net annual profit


    Revenue benchmarks by sport

    Tennis (per court, per hour)

    MarketPeak rateOff-peak rate
    London / New York£60–£110 / $70–$130£30–£60 / $35–$75
    Regional UK cities£20–£40£12–£22
    US suburban markets$25–$60$15–$35

    Football / Soccer (per pitch, per hour)

    Pitch typePeak rate (UK)Peak rate (US)
    5-a-side£55–£120$60–$140
    11-a-side£120–£280$130–$300

    Pickleball (per court, per hour)

    MarketDrop-in rateCourt hire rate
    US suburban$8–$20 per player$25–$60 per court
    US urban$12–$30 per player$40–$90 per court

    Padel (per court, per hour)

    MarketPeak rateOff-peak rate
    UK£30–£65£18–£40
    Spain / France / Germany€20–€45€12–€28

    Revenue model: 4-court tennis dome (US suburban, year-round)

    • Capital cost: $520,000 | Operating costs: $70,000/year
    • Weekly total revenue: ~$9,870
    • Annual gross: ~$513,000
    • Net annual profit: ~$445,000
    • Payback period: ~14 months (high-utilisation scenario)
    • Conservative scenario (55–60% utilisation): net profit $200,000–$280,000, payback 2–3 years

    Revenue model: soccer dome, 11-a-side (UK, year-round)

    • Capital cost: £1,600,000 | Annual operating costs: £160,000
    • Annual gross: £365,000 | Net profit: £205,000
    • Payback: ~7.8 years (adding tournaments and academies reduces to 5–6 years)

    Revenue model: 4-court pickleball dome (US suburban, seasonal)

    • Capital cost: $380,000 | Annual operating costs: $55,000
    • Total seasonal revenue: ~$280,000 | Net profit: $225,000
    • Payback: ~1.7 years

    Realistic ROI ranges by dome type

    Dome typeCapital costNet annual profit rangePayback range
    2-court seasonal tennis bubble$160,000–$250,000$60,000–$130,0001.5–3.5 yrs
    4-court year-round tennis dome$500,000–$800,000$150,000–$400,0002–5 yrs
    4-court pickleball dome (seasonal)$300,000–$500,000$130,000–$280,0001.5–3 yrs
    Multi-sport dome (5-a-side + courts)$700,000–$1,400,000$150,000–$400,0003–6 yrs
    11-a-side soccer dome (year-round)$1,200,000–$2,500,000$100,000–$300,0005–10 yrs

    What drives the biggest variance in payback period

    1. Utilisation rate — every 10% additional utilisation changes annual net profit by $40,000–$150,000.
    2. Programming vs pure rental — leagues, academies, and tournaments consistently outperform court-hire-only models.
    3. Peak/off-peak ratio — monetising daytime weekday slots dramatically improves unit economics.
    4. Capital cost per m² — cheapest dome is not necessarily best ROI.
    5. Energy cost — specification decisions (skin count, heat pump, LED) have large financial impact.

    Payback period most operators achieve

    • Top quartile (high demand, strong programming, high utilisation): 1.5–3 years
    • Median (good market, moderate programming, 60–70% utilisation): 3–5 years
    • Bottom quartile (weaker market, rental-only): 6–10+ years

    HeroX AirDomes provides detailed ROI modelling as part of the feasibility process for all new projects.

  • Air Dome vs Traditional Building: A Real Cost Comparison (2026)

    Air Dome vs Traditional Building: A Real Cost Comparison (2026)

    Air dome vs traditional building — every developer who has seen this cost comparison side by side has walked away reconsidering their assumptions.

    The most common question any sports facility developer faces is whether to build a permanent steel-and-concrete structure or go with an air-supported dome.


    The core trade-off

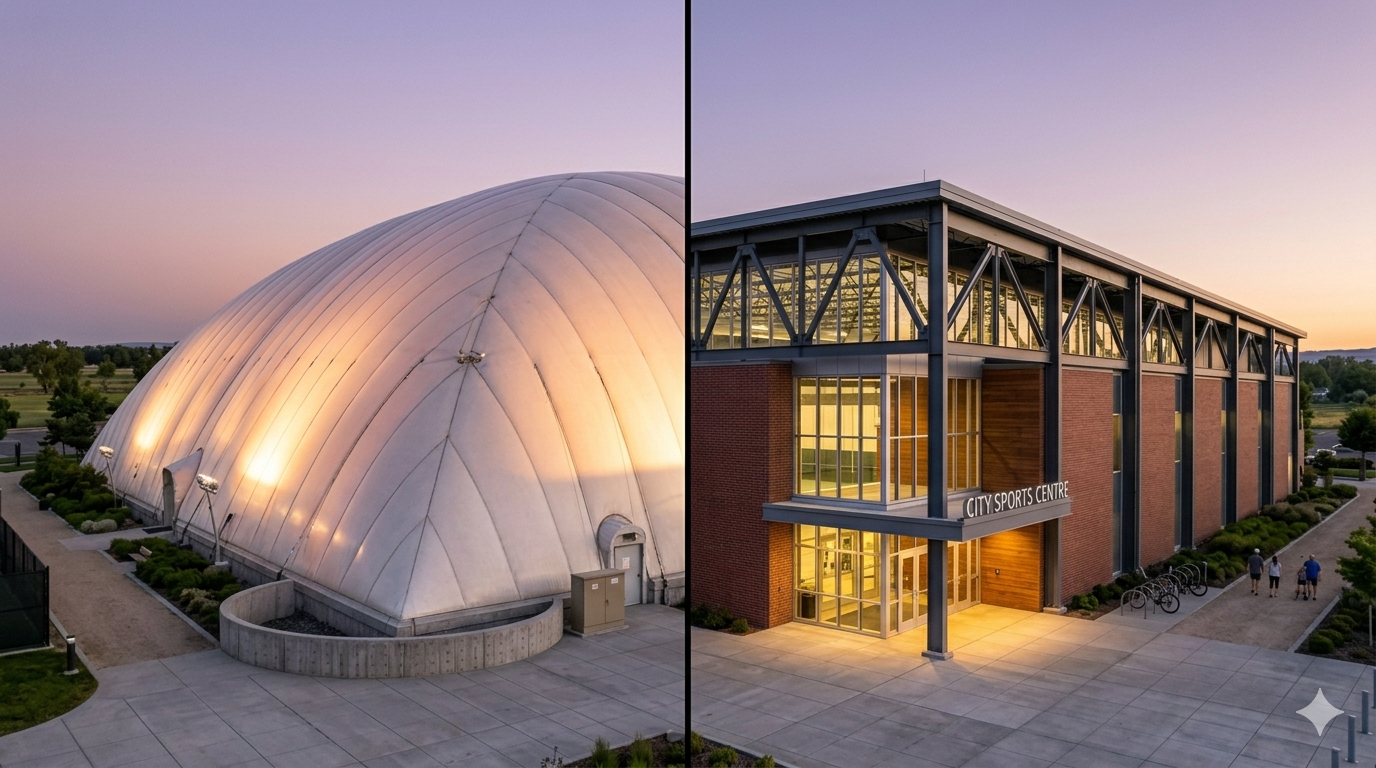
    An air dome costs 25–50% of a comparable permanent sports building to build, but has higher annual running costs and a shorter service life.


    Capital cost comparison (20,000 sq ft / 1,860 m² multi-sport facility)

    Cost elementAir domeTraditional steel building
    Structure / shell$180,000–$320,000$800,000–$1,400,000
    Foundation works$40,000–$120,000$150,000–$350,000
    HVAC / mechanical$45,000–$90,000$120,000–$280,000
    Lighting$20,000–$45,000$30,000–$70,000
    Sports flooring$100,000–$350,000$100,000–$350,000
    Total (excl. flooring)$325,000–$750,000$1,300,000–$2,650,000

    Build time comparison

    MilestoneAir domeTraditional building
    Contract to planning approval4–20 weeks13–52 weeks
    Total to first use4–10 months12–24 months

    Speed matters: an air dome generating revenue from month 6 vs a building generating revenue from month 18 represents 12 months of income difference — often $100,000–$400,000 in foregone revenue.


    Annual operating cost comparison (same 20,000 sq ft facility)

    Cost elementAir domeTraditional building
    Energy$28,000–$75,000/yr$18,000–$45,000/yr
    Routine maintenance$8,000–$18,000/yr$12,000–$30,000/yr
    Insurance$6,000–$18,000/yr$5,000–$14,000/yr
    Total annual operating$42,000–$130,000/yr$37,000–$95,000/yr

    20-year total cost of ownership

    Cost elementAir dome (20 yrs)Traditional building (20 yrs)
    Initial capital$700,000$2,200,000
    Annual energy (×20)$1,000,000$620,000
    Annual maintenance (×20)$260,000$420,000
    Membrane replacement (year 18)$200,000$0
    Total 20-year cost$2,160,000$3,240,000

    The dome costs $1,080,000 less over 20 years in this model.


    User experience: what the numbers don’t capture

    In favour of the air dome: natural diffuse daylight, completely column-free interior, better acoustics, faster temperature stabilisation.

    In favour of the permanent building: premium feel, easier ancillary spaces, no airlock, quieter, treated as real property by lenders.


    Which is right for your project?

    Choose an air dome if: capital is the binding constraint, you need the facility open within 12 months, you are on leased land, or planning permission for a permanent structure is uncertain.

    Choose a traditional building if: you have a 30-year+ time horizon and freehold land, energy costs are very high, or you want a premium user experience.

    Consider a hybrid: permanent building for changing rooms and reception; air dome for the main sports hall.


    HeroX AirDomes specialises in air-supported structures across the US, UK, Europe, and UAE.